Video on how to calculate the infiltration parameter Ksat using an Excel template (Spanish but shows steps, English version coming soon)
Materials
- Ring made of a can or other strong cylinder, with diameter 12 to 20 cm, height of at least 10 cm.
- Measuring cup size 350 mL or 500 mL, with legible markings that allow a precision of around 10 mL in filling the cup.
- Slightly bent spoon or other object to protect the spot where water is poured onto the soil (Fig. 1 below)
- A block of wood and a hammer may be needed to install the ring in the soil.
- Cell phone stopwatch app, or simply the stopwatch function on a watch. Ideally, the stopwatch or app has a lap function that will allow you to record the time as you pour each new cup of water into the ring, while continuing to run the time. See “simple stopwatch” on Android Google Play or other application source, which also allows you to send a table of results by email or text message, which is very convenient to process the data.
- 1 or 2 buckets filled with water to provide the volumes of water to pour into the ring.
Procedure
- Select the site and remove any large organic matter or roots from the surface. Plants can be trimmed, but should not be uprooted, and small stones can be left.
- Press the ring into the ground, ideally to a depth of about 2 cm. You may need a block of wood to apply even pressure to the top of the ring, and even pounding with a stone or hammer. If you find a thick root or stone that prevents the ring from being placed, move the ring slightly or use another location. Also, if the inside of the ring has soil removed or disturbed, you can press some soil from the outside of the ring into the spaces to seal any gaps or holes against the inside wall.
- Place the spoon leaning against the inside wall and bent so that the bowl of the spoon is directly against the soil. The bowl of the spoon is now creates a hard surface where you can pour the water so that it does not disturb the soil. The spoon can remain for the entire process.
- Decide how much water to pour into the ring each time. You will repeat filling the ring about 2 cm deep with water 10 to 15 times. The following table shows the amount to add according to the diameter of the ring. If you are dealing with a high-clay or compacted soil with very slow infiltration you should reduce these quantities by about 30% to 50%, to reduce the time it takes for the measurement.
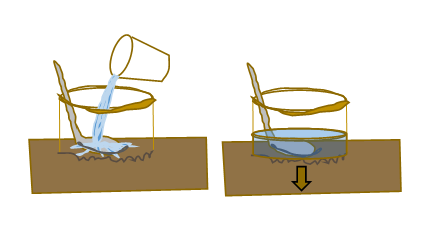
Figure 1. On the left, pouring water into the ring with a spoon bent to protect the soil from water impact. On the right, ring with water about 2 cm deep at the beginning of each round of measurement, infiltrating into the soil.
- At the same moment you start measuring with the stopwatch, pour the water into the ring, and then record the time it takes to infiltrate. In very dry or porous soil, you should be ready very quickly to record the first time the water soaks in and pour the next cup of water. it may be as little as 10 seconds.
- It can be challenging to define the point when water has completely infiltrated. If there is some irregularity in the ground surface within the ring, choose the highest point of the soil within the ring, i.e., where the soil surface first begins to show as the water level drops. When this highest point is exposed, add the next volume of water (same as the first and over the spoon to avoid eroding) and record the time. This is where a lap timer will be especially useful.
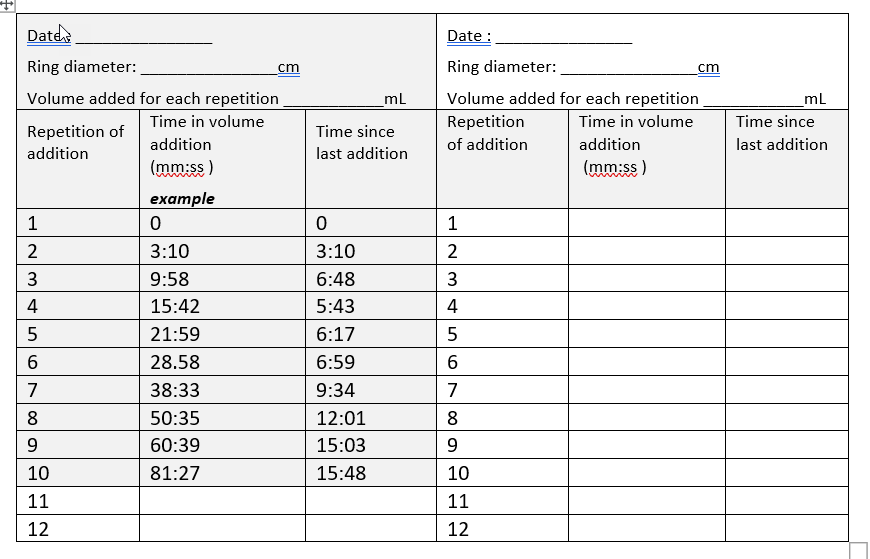
- Continue adding volumes of water and recording the time when each is added. It is a good idea to record them on paper even if the stopwatch is also helping you record. Your chart will look like the example below. You should try to record at least 8 infiltration times, and 10 or 12 is even better.
- As you continue, the infiltration time of each amount will increase, but it should also begin to stabilize somewhat. You can make a mental note of the amount of time it takes for each volume to penetrate. The time it takes after about 4 or 5 additions of water is already an indicator of infiltration. For example, a soil in which it only takes 1.5 minutes for each volume to soak in is fast, while a soil that takes 10 minutes to soak in this 2 cm depth would have slow infiltration. As noted above, in a soil with very slow infiltration, the volume should be decreased to make each measurement take less time and still record about 8 to 10 infiltration times.
- You should end up with a table like the following. The left side has been filled in as an example, while the right side is left blank for practicing.
Analyzing the results qualitatively before calculating the saturated hydraulic conductivity in a quantitative way:
- Before performing infiltration rate calculations with a formal parameter such as saturated conductivity, think about some practical and intuitive measures of soil infiltration. The saturated conductivity calculated below is just a more formal version of these practical measures, intended to estimate how quickly water can pass into the soil during a rain event.
For example:- How many mm of water infiltrate in the first twenty minutes? This could be comparable to the onset of a thunderstorm with heavy rain. You can roughly calculate this by looking at the information in the table together with the depth in mm that was poured into the ring at each turn of the measurement. For example, you see in the example in the table, then in the fifth row of the table it reaches 21 minutes, or about 20 minutes for 5 additions x 2 cm of water or 100 mm of “rain”. This is a kind of indicator of how a soil may behave during a downpour and whether there will be runoff.
- What infiltration rate is observed directly after 10 minutes or some other time chosen to allow for initial soil wetting? This is like an unofficial version of saturated conductivity (estimated below with an Excel spreadsheet). For example, after four additions of water in the example on the previous page, you may notice that the infiltration period is always between 5 and 7 minutes for 2 cm water to infiltrate. So, you could take the average time, say about 6 minutes, and divide it by 2 cm, equivalent to 20 mm, to get an approximate infiltration rate:
Approximate infiltration rate = 2 cm / 6 minutes = 20 mm / 6 minutes = 3.3 mm/ minute
-
- Extrapolating to one hour of rain, this would be 200 mm of rain for one hour of rain that could be absorbed, that’s quite a lot of rain! The saturated conductivity will always be a little lower than this, but you can see that such a soil will have a fairly high rain absorption capacity. See the table below for more conversions of these rates.
- Consider the other factors that will influence infiltration. If the soil does not have good aggregation, then the impact of rain can destroy the aggregates and seal the soil surface. Therefore, to assess soil health the measurement of infiltration should be combined with consideration of the soil cover (plants, debris), which cushions the impact of raindrops and the stability of the soil aggregates (which strengthens the soil against crusting and sealing). If the soil is on a slope and has a gradient, this will make runoff even more likely, rather than infiltration.
Estimation of the saturated infiltration rate or Ksat (modified Beerkan method) using a an Excel template.
- Find the Excel spreadsheet that allows the calculation of Ksat using the modified Beerkan method; this can be downloaded from https://smallholder-sha.org .
- You will need the following information to complete the Excel form:
- The diameter of the ring in cm.
- The volume of water added each time, e.g. 350 mL
- Times in mm:ss format for each water volume addition, in the results table above.
- Enter the information and then follow the instructions on the Excel sheet.
- There is an important step in the Excel sheet: when you define the range of points on the infiltration trend graph that you want to include when fitting a line to the data (regression). This then allows you to find the slope of a regression line for the results, which is necessary to enter into the Excel form so that you can estimate the saturated conductivity of the soil. This saturated conductivity represents the rate at which the soil can continuously absorb water.
- You can apply the same criteria for the saturated infiltration rate as for the quick estimates above, using the same comparison to the hourly rainfall rates you found earlier. The following table can help you interpret these infiltration rates and compare them to the imagined rainfall rates:
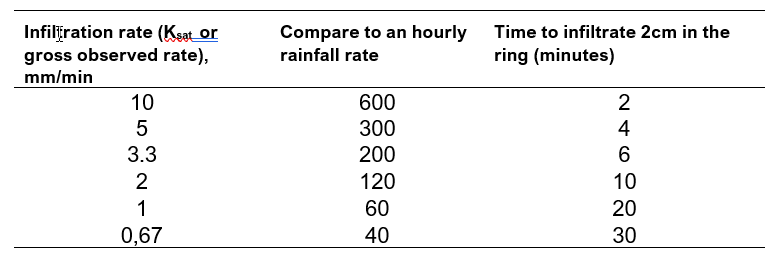
Table indicating the correspondence between an estimate of saturated conductivity in mm/minute (right), a rainfall rate in mm/hour (center), and a time in minutes to infiltrate 2 cm of water in the infiltration test (left).